Recent work
A signal-led mix of D3.js, SVG, Tableau, Vega-Lite, and analytics builds. Each project translates raw data into a clear decision story.
D3.js Projects

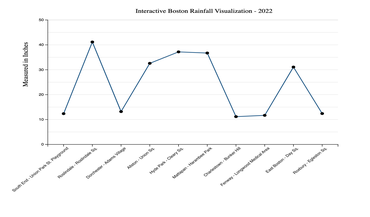
Boston Rainfall DataViz
Visualizing Boston rainfall data with D3.js.
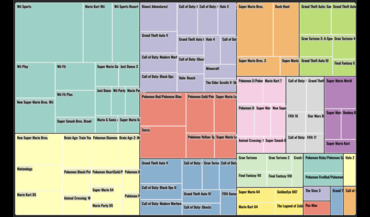
Tree Map - Video Games Sale
Top 100 most sold video games grouped by platform.
SVG Projects
Boston Rainfall DataViz (SVG)
Visualizing Boston rainfall data with SVG (no framework).

UMass Boston Visualization (SVG, GSAP)
Department and faculty ratings visualized with SVG + GSAP.
Tableau Projects


Massachusetts Public Schools Analysis
Public schools analysis and story in Tableau.
Open Source Projects
Vega-Lite
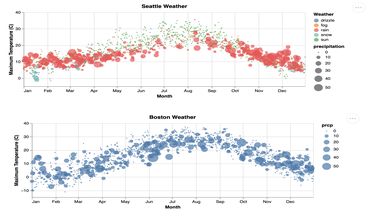
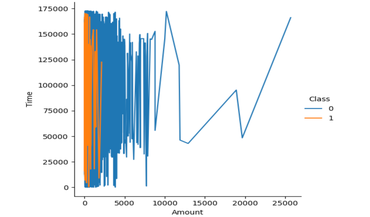
Vega-Lite Rainfall Chart
Interactive rainfall comparison of Boston and Seattle (2013-2016).

Dunkin vs Starbucks USA
Dunkin vs Starbucks stores comparison in the United States.
Analytics
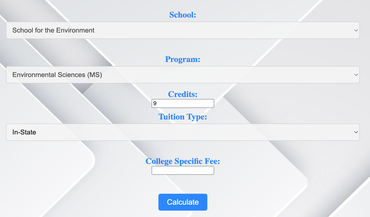
Graduate Fee Calculator - UMass Boston
Forecast your semester or annual fees with a simple calculator.
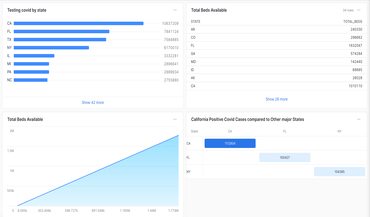
Visualize Covid-19 Data
Leveraging SnowflakeDB and SQL to create dashboards and charts.