Case Study
Boston Rainfall DataViz
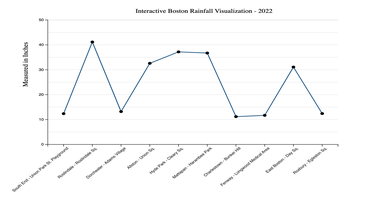
An interactive D3.js visualization that explores rainfall patterns in Boston and makes long-term trends easy to scan.
Role
Data analyst + front-end developer
Built the visualization, structured the dataset, and shaped the narrative flow.
Tools
D3.js, SVG, JavaScript
Focused on interactive charts, transitions, and clear labeling.
Focus
Trend clarity
Made seasonal patterns visible without overwhelming the viewer.
Story arc
Goal
Turn raw rainfall data into a story that highlights long-term shifts and extremes.
Approach
Combined interactive tooltips, annotated peaks, and a layered view for quick comparison.
Highlights
Readable at a glance
Color cues and spacing emphasize monthly patterns without sacrificing precision.
Interactive discovery
Hover states and annotations keep the viewer oriented while they explore.
Explore more projects
Dive into the full archive of analytics and visualization.